Over 700,000 Americans have devoted themselves to the police workforce, putting their lives on the line to protect and serve the citizens they represent.
Law enforcement officers are often the first responders in the face of an accident, emergency, or tragedy, yet despite their dedicated service, they often find themselves in a pay bracket below their counterparts in the business and health industries.
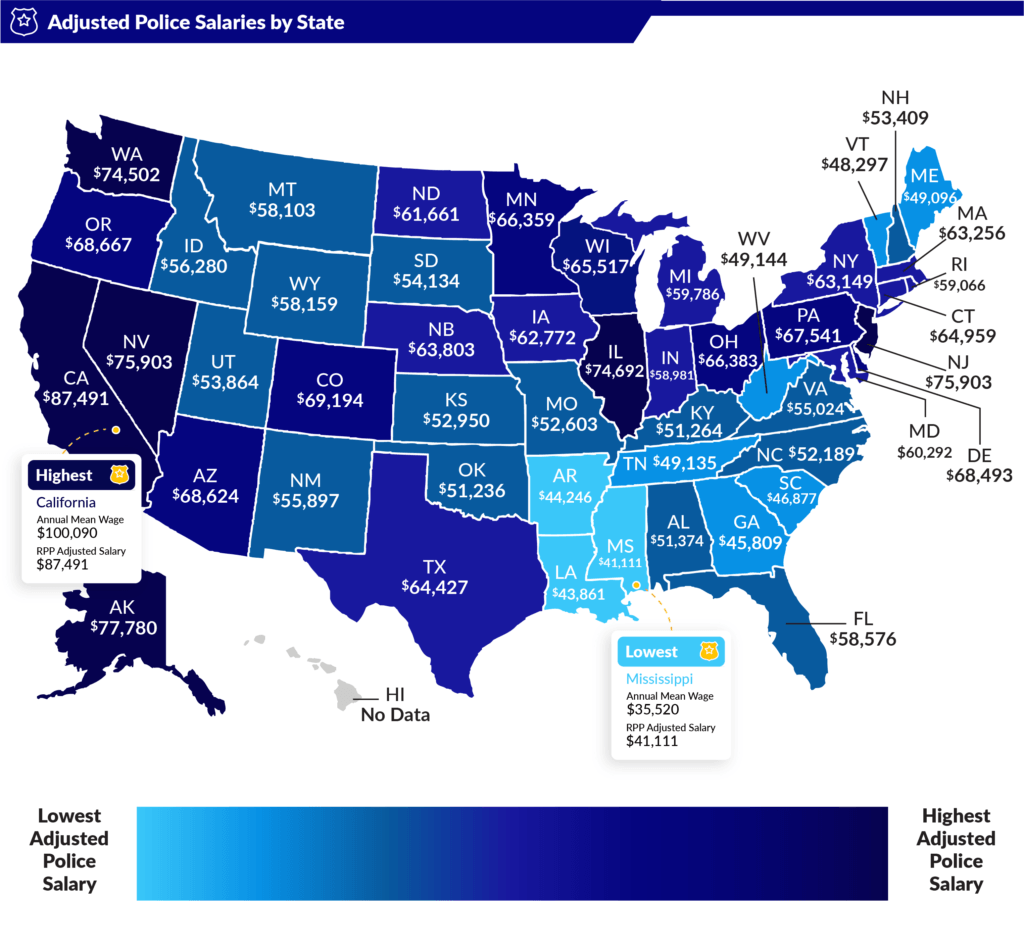
Take a look at our map below to see what police officers earn around the country and how their salaries compare to the cost of living in their respective areas.
When we compiled the data, we found that police officer salaries range from about $35,000 per year to $100,000 per year, with a national average of $64,490.
That gap wasn’t the only interesting thing we uncovered:
- California ranks first in both actual salary ($100,090) and adjusted salary ($87,491). California also has the second-highest cost of living of any state in the US, according to CNBC.
- Mississippi ranks 49th in both actual salary ($35,520) and adjusted salary ($41,111). That puts Mississippi in last place for our ranking (Hawaii did not release salary estimates, so it was excluded from the data).
- Despite the low salary, Mississippi has the highest rate of police officers, with 6.741 of every 1,000 employed persons donning a hat and badge. Washington has the lowest rate, with 3.015 of every 1,000 employed persons being a police officer.
- The average difference between a state’s adjusted salary rank and its actual salary rank was 3.26. The biggest difference was New York, which ranks 7th for actual salary ($73,000) but 18th for adjusted salary ($63,149). New York is fourth in the country for high cost of living.
- As mentioned above, California police officers are the highest paid across the nation. California also tied with Florida, Texas, and New York for most police officer deaths in 2018, with eleven deaths each. Only fourteen states reported no deaths in 2018.
Methodology
To gather the raw data for this analysis, we pulled salaries from the May 2017 Occupational Employment and Wages report, released by the Bureau of Labor Statistics for Police and Sheriff’s Patrol Officers. We then obtained Regional Price Parities (RPP), which measure the difference in price level between states and metro areas, from the Bureau of Economic Analysis. The adjusted salary numbers were calculated by dividing the annual mean salary by the price parity. The adjusted salary represents purchasing power based on the cost of living in each state.
Salary List/Table
| State | Annual Mean Wage | RPP Adjusted Salary |
|---|---|---|
| Mississippi | $35,520 | $41,111 |
| Arkansas | $38,450 | $44,246 |
| Louisiana | $39,650 | $43,861 |
| Georgia | $42,190 | $45,809 |
| South Carolina | $42,330 | $46,877 |
| West Virginia | $43,050 | $49,144 |
| Tennessee | $44,320 | $49,135 |
| Alabama | $44,490 | $51,374 |
| Kentucky | $45,010 | $51,264 |
| Oklahoma | $45,600 | $51,236 |
| Missouri | $47,080 | $52,603 |
| North Carolina | $47,440 | $52,189 |
| South Dakota | $47,800 | $54,134 |
| Kansas | $47,920 | $52,950 |
| Maine | $48,310 | $49,096 |
| Vermont | $49,070 | $48,297 |
| New Mexico | $52,320 | $55,897 |
| Idaho | $52,340 | $56,280 |
| Utah | $52,410 | $53,864 |
| Indiana | $53,260 | $58,981 |
| Montana | $54,590 | $58,013 |
| Michigan | $55,780 | $59,786 |
| Wyoming | $56,240 | $58,159 |
| Virginia | $56,290 | $55,024 |
| North Dakota | $56,420 | $61,661 |
| New Hampshire | $56,560 | $53,409 |
| Iowa | $56,620 | $62,772 |
| Nebraska | $57,090 | $63,083 |
| Florida | $58,400 | $58,576 |
| Rhode Island | $58,830 | $59,066 |
| Ohio | $59,280 | $66,383 |
| Wisconsin | $60,800 | $65,517 |
| Texas | $62,430 | $64,427 |
| Minnesota | $64,700 | $66,359 |
| Arizona | $65,810 | $68,624 |
| Maryland | $66,020 | $60,292 |
| Pennsylvania | $66,460 | $67,541 |
| Massachusetts | $68,190 | $63,256 |
| Oregon | $68,530 | $68,667 |
| Delaware | $68,630 | $68,493 |
| Connecticut | $70,610 | $64,959 |
| Colorado | $71,270 | $69,194 |
| New York | $73,000 | $63,149 |
| Illinois | $73,870 | $74,692 |
| Nevada | $73,930 | $75,903 |
| Washington | $78,600 | $74,502 |
| Alaska | $81,980 | $77,780 |
| New Jersey | $83,570 | $73,825 |
| California | $100,090 | $87,491 |
About YourLocalSecurity.com
YourLocalSecurity.com aims to provide the security tools and information needed to build a safer home environment. For media inquiries, please contact media@yourlocalsecurity.com.


